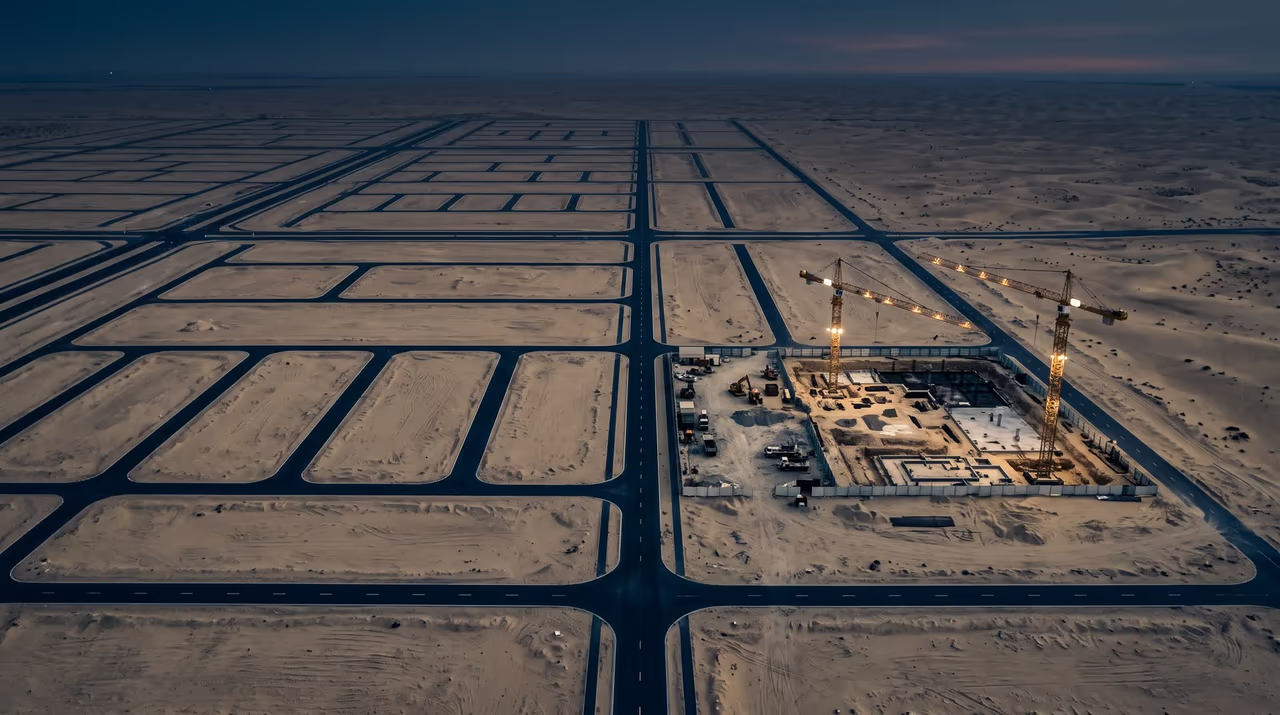
Dubai Land Department open data
Market data
A structured report for every zone we cover: prices, absorption, supply, buyer mix and the DEVOS score.
DLD transaction data is used only for covered price indicators and transaction volume; Ejari data supports yields where published. Other figures are seeded DEVOS estimates dated June 2026. The DEVOS score is manually assigned for this demonstration; it has no validated weighting formula or predictive track record. Transaction volume is not a project sell-through rate. These indicators are not investment recommendations. Data & methodology
- Zones covered
- 32
- Zones on recorded transactions
- 23
- Transactions in the medians
- 82,559
- Period covered
- 2025-11 to 2026-11
Zone heatmap
Compare zones on the metrics developers actually use. Approximate boundaries, estimated data, updated monthly.
Recorded, DLD, 12 months
Loading the map
Sale price and sales per month come from recorded Dubai Land Department transactions. Land price, off-plan supply and the DEVOS score are our own estimates and are labelled as such. Polygons are indicative, not cadastral.
Dubai
26 zones
| Zone | Sale price source | Median sale price / sqft | Land price / sqft GFA (Estimated) | Gross rental yield | DEVOS score (illustrative) |
|---|---|---|---|---|---|
| Recorded zonesSale and off-plan medians computed from Dubai Land Department transaction records. | |||||
| Jumeirah Village CircleMomentum | DLD 2025-11 to 2026-11 | 1,293 | 235 | 7%Ejari / DLD | 84 |
| MBR City (District One / Meydan)Momentum | DLD 2025-11 to 2026-11 | 1,990 | 360 | 6.5%Ejari / DLD | 81 |
| Arjan (Dubailand)Emerging | DLD 2025-11 to 2026-11 | 1,361 | 185 | 6.3%Ejari / DLD | 80 |
| Dubai SouthEmerging | DLD 2025-11 to 2026-11 | 1,131 | 125 | 6.7%Ejari / DLD | 79 |
| MeydanMomentum | DLD 2025-11 to 2026-11 | 1,662 | 345 | 5.5%Ejari / DLD | 79 |
| Business BayPrime | DLD 2025-11 to 2026-11 | 1,846 | 465 | 6%Ejari / DLD | 78 |
| Jumeirah Village TriangleMomentum | DLD 2025-11 to 2026-11 | 1,346 | 215 | 6.6%Ejari / DLD | 78 |
| Dubai Creek HarbourMomentum | DLD 2025-11 to 2026-11 | 2,319 | 410 | 5.5%Ejari / DLD | 77 |
| Al FurjanMomentum | DLD 2025-11 to 2026-11 | 1,093 | 205 | 7%Ejari / DLD | 77 |
| Dubai Hills EstatePrime | DLD 2025-11 to 2026-11 | 2,230 | 520 | 5.8%Ejari / DLD | 76 |
| Dubai Maritime CityEmerging | DLD 2025-11 to 2026-11 | 2,138 | 375 | 6%DEVOS | 76 |
| Al JaddafMomentum | DLD 2025-11 to 2026-11 | 1,783 | 265 | 4.7%Ejari / DLD | 75 |
| Downtown DubaiPrime | DLD 2025-11 to 2026-11 | 2,460 | 820 | 5.3%Ejari / DLD | 74 |
| Dubai Studio CityEmerging | DLD 2025-11 to 2026-11 | 947 | 155 | 8.6%Ejari / DLD | 72 |
| Dubai MarinaPrime | DLD 2025-11 to 2026-11 | 1,815 | 510 | 5.8%Ejari / DLD | 71 |
| Town SquareEmerging | DLD 2025-11 to 2026-11 | 1,355 | 140 | 6.1%Ejari / DLD | 71 |
| Jumeirah Lake TowersMomentum | DLD 2025-11 to 2026-11 | 1,432 | 390 | 6.7%Ejari / DLD | 69 |
| Dubai Sports CityEmerging | DLD 2025-11 to 2026-11 | 990 | 140 | 8.1%Ejari / DLD | 69 |
| Damac Hills 2Emerging | DLD 2025-11 to 2026-11 | 1,048 | 95 | 7.2%DEVOS | 68 |
| City Walk / Al WaslPrime | DLD 2025-11 to 2026-11 | 2,728 | 860 | 4.6%Ejari / DLD | 68 |
| Dubai Silicon OasisEmerging | DLD 2025-11 to 2026-11 | 961 | 150 | 7.1%Ejari / DLD | 67 |
| Palm JumeirahPrime | DLD 2025-11 to 2026-11 | 2,687 | 940 | 4.6%Ejari / DLD | 66 |
| JBR / BluewatersPrime | DLD 2025-11 to 2026-11 | 1,587 | 990 | 5.8%Ejari / DLD | 62 |
| Estimated zonesSeeded from public listings, published indices and DEVOS field data, pending a certified feed. | |||||
| Dubai IslandsEmerging | DEVOS 2026-06 | 2,140 | 455 | 5.4%DEVOS | 83 |
| Emaar SouthEmerging | DEVOS 2026-06 | 1,050 | 130 | 6.6%DEVOS | 74 |
| DIFCPrime | DEVOS 2026-06 | 2,560 | 780 | 5.3%DEVOS | 70 |
Abu Dhabi
3 zones
| Zone | Sale price source | Median sale price / sqft | Land price / sqft GFA (Estimated) | Gross rental yield | DEVOS score (illustrative) |
|---|---|---|---|---|---|
| Estimated zonesSeeded from public listings, published indices and DEVOS field data, pending a certified feed. | |||||
| Yas IslandMomentum | DEVOS 2026-06 | 1,420 | 260 | 6.5%DEVOS | 75 |
| Saadiyat IslandPrime | DEVOS 2026-06 | 2,380 | 640 | 4.9%DEVOS | 72 |
| Al Reem IslandMomentum | DEVOS 2026-06 | 1,230 | 215 | 7%DEVOS | 70 |
Sharjah
2 zones
| Zone | Sale price source | Median sale price / sqft | Land price / sqft GFA (Estimated) | Gross rental yield | DEVOS score (illustrative) |
|---|---|---|---|---|---|
| Estimated zonesSeeded from public listings, published indices and DEVOS field data, pending a certified feed. | |||||
| AljadaEmerging | DEVOS 2026-06 | 870 | 105 | 7.4%DEVOS | 73 |
| Tilal CitySpeculative | DEVOS 2026-06 | 640 | 55 | 7.1%DEVOS | 55 |
Ras Al Khaimah
1 zones
| Zone | Sale price source | Median sale price / sqft | Land price / sqft GFA (Estimated) | Gross rental yield | DEVOS score (illustrative) |
|---|---|---|---|---|---|
| Estimated zonesSeeded from public listings, published indices and DEVOS field data, pending a certified feed. | |||||
| Al Marjan IslandMomentum | DEVOS 2026-06 | 1,740 | 330 | 6.2%DEVOS | 82 |
DEVOS score out of 100
Estimated values, pending certified data feed
Price data: Dubai Land Department open data. DEVOS is not affiliated with or endorsed by the Government of Dubai.